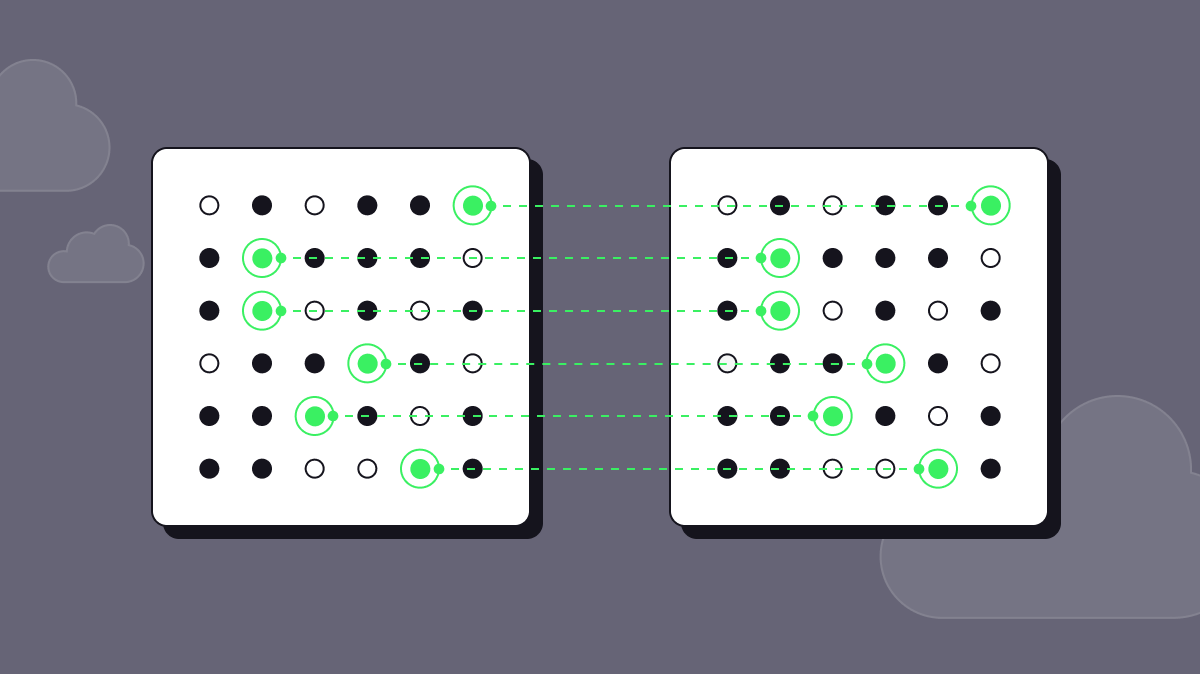
As introduced in our previous blog post, we've released the Bias Mitigation feature of the Synthesized platform, which is able to automatically replace the identified biased groups in data with synthesized groups. We believe privacy, fairness and ethical use of data should be key elements of any data-driven company and that it’s important to proactively work towards actually solving the issue of biases in data and hence algorithmic biases.
You can install a free 30-day trial of the SDK or simply get in touch with our Sales team.
So how does it work?
In an earlier blog post we discussed algorithmic bias and data bias, and what distinguishes these two concepts. Bias in machine learning models is commonly seen to arise directly from the data it is trained on. One key aspect of our platform is its capability for bias mitigation, ensuring that the data used for training models is as fair and unbiased as possible.
The process of understanding and correcting bias using the Synthesized platform is a three-step process:
- Identify biases in a range of sensitive attributes across the entire dataset
- Quantify these biases with a single interpretable number, something we call a Fairness Score
- Automatically mitigate these biases with the power of Synthesized Core Technology
Bias identification
The process starts by specifying a target variable against which biases are to be identified (for example, the annual income of credit applicants), and clicking on “Analyze”.

From here, the platform analyzes the data through a complex process of data preprocessing, labelling, and statistical interpretation of the entire dataset. The platform automatically identifies and groups legally protected attributes in the UK and US such as age, nationality, race and sex, and from here determines any bias of the target variable within these groups. (Read more about these sensitive attributes in our previous blog post).
This bias mitigation process normally takes just a few minutes and we provide a number of sample datasets to demonstrate this capability with the platform. It can also be launched multiple times to understand the biases across different target variables.
Note that this version assumes that the entire dataset is a fair representation of the underlying phenomena. It further assumes that the legally protected attributes are distinguishable. We also plan to provide an annotation capability for the labelling of more sophisticated attributes. The platform is designed to provide ground for further investigation and effective bias mitigation.
Bias score
For each identified group of attributes (or columns within the data), the platform assigns a Bias Score for the chosen target variable. This score represents how different the target variable is for the group compared to the rest of the dataset and ranges from -100% to +100%. Higher values indicate the group has been calculated to have more bias compared to the rest of the identified groupings.
Let’s look at a few examples:

The above graphic demonstrates a concrete example where the platform has identified multiple groups of sensitive customer attributes. The target variable is chosen to be “Income”, and we can see that the group of {age = (33.0, 41.0), marital.status = Married-civ-spouse, sex = Female} has a positive bias of 32.9%.
So what does this value mean? There are two important things to look at to understand this value:
- The absolute value (from 0% to 100%) tells us how different the target distribution is for this sensitive group with respect to the rest of the population.
- The sign (positive or negative) determines the direction of the bias. For the income example, positive biased groups have higher income than the rest while negative ones have lower income.
We use statistical techniques to ensure that these biases do not arise through a statistical fluke, and you can be confident that they are inherent to the data. This is a critical component of our bias mitigation approach.
Fairness score
All identified biases in the dataset are aggregated to form the Fairness Score. It equally takes into the account the positive and negative biases and provides a method to readily compare the biases across multiple datasets.
The Fairness Score ranges from 0 to 1, with 1 meaning perfectly unbiased and 0 being heavily biased. Our platform's bias mitigation feature plays a crucial role in achieving higher Fairness Scores by systematically addressing and mitigating biases in the dataset.
FAQs
What is bias mitigation, and why is it important in data-driven projects?
Bias mitigation refers to the processes and techniques used to identify, quantify, and reduce biases within datasets. It is crucial because biased data can lead to unfair and inaccurate outcomes in AI and machine learning models. Effective bias mitigation ensures that these models make decisions that are fair and representative of diverse populations, ultimately leading to more ethical and reliable data-driven projects.
How does bias mitigation impact the development of machine learning models?
Bias mitigation directly influences the development of machine learning models by ensuring that the training data used is as unbiased as possible. This process helps prevent the models from learning and perpetuating existing biases present in the data. By integrating bias mitigation techniques, developers can create models that perform more equitably across different groups, leading to more generalizable and trustworthy predictions.
What are some common methods used for bias mitigation in datasets?
Several methods are commonly used for bias mitigation in datasets. Preprocessing involves modifying the data before it is used to train models to eliminate or reduce biases. In-processing adjusts the learning algorithm to minimize bias during the model training phase. Post-processing alters the output of the models to correct biases that may have been introduced during training. Each method has its advantages and can be selected based on the specific requirements of the project.
Can bias mitigation completely eliminate biases from data and models?
While bias mitigation significantly reduces biases in data and models, it is challenging to eliminate all biases completely. Biases can be deeply ingrained, making them difficult to identify and remove entirely. However, continuous improvement in bias mitigation techniques, combined with regular evaluation and updates, can greatly minimize the impact of biases, ensuring more fair and ethical outcomes in data-driven applications.
How can organizations implement bias mitigation strategies effectively?
Organizations can implement bias mitigation strategies effectively by regularly assessing datasets and models for biases, training data scientists and developers on the importance of bias mitigation and how to apply relevant techniques, and utilizing specialized tools and platforms designed for bias identification and mitigation. Establishing clear policies and guidelines that prioritize fairness and ethical standards in data usage and AI development is also essential. By integrating these strategies into their workflows, organizations can proactively address biases and enhance the fairness and reliability of their data-driven solutions.