


In this article, we will share a practical way of measuring fairness in a machine learning pipeline, using statistical distances to measure the disparity in probability distributions pertaining to legally protected features. These methods are simple to adapt to different problems and provide a generic way of reasoning about the fairness of arbitrary discrete or continuous random variables toward discrete sensitive variables. We will use these methods to quantify discriminatory patterns exhibited in a pretrial risk assessment tool called COMPAS. You can find the complete analysis in this notebook.
What is Fairness in Fair Machine Learning
Machine learning is increasingly used to aid in making high-impact decisions such as hiring, granting loans, insurance, or even determining how much time someone spends in prison. However, recently, we have started to see that training machine learning models on inherently biased data can result in algorithms that discriminate towards individuals based on features such as age, gender, or ethnicity. The implications of biased algorithms making sensitive decisions on a large scale can be alarming, and it’s becoming increasingly important to ensure the models we build are fair through fair machine learning practices.

There are multiple definitions of fairness in literature, and while many can be contentious, results are often considered fair if they are independent of legally protected or sensitive characteristics such as age, gender, and ethnicity [1].
You may wonder, “if we’re trying to achieve independence, why not just drop the sensitive features?”. Unfortunately, there tends to be a level of causality between features in practice, which results in proxies for sensitive attributes being encoded in the other attributes used during training. For instance, a person’s age can act as a proxy for their socioeconomic status. As a result, in many biased datasets, the bias persists in models trained without the sensitive attributes.
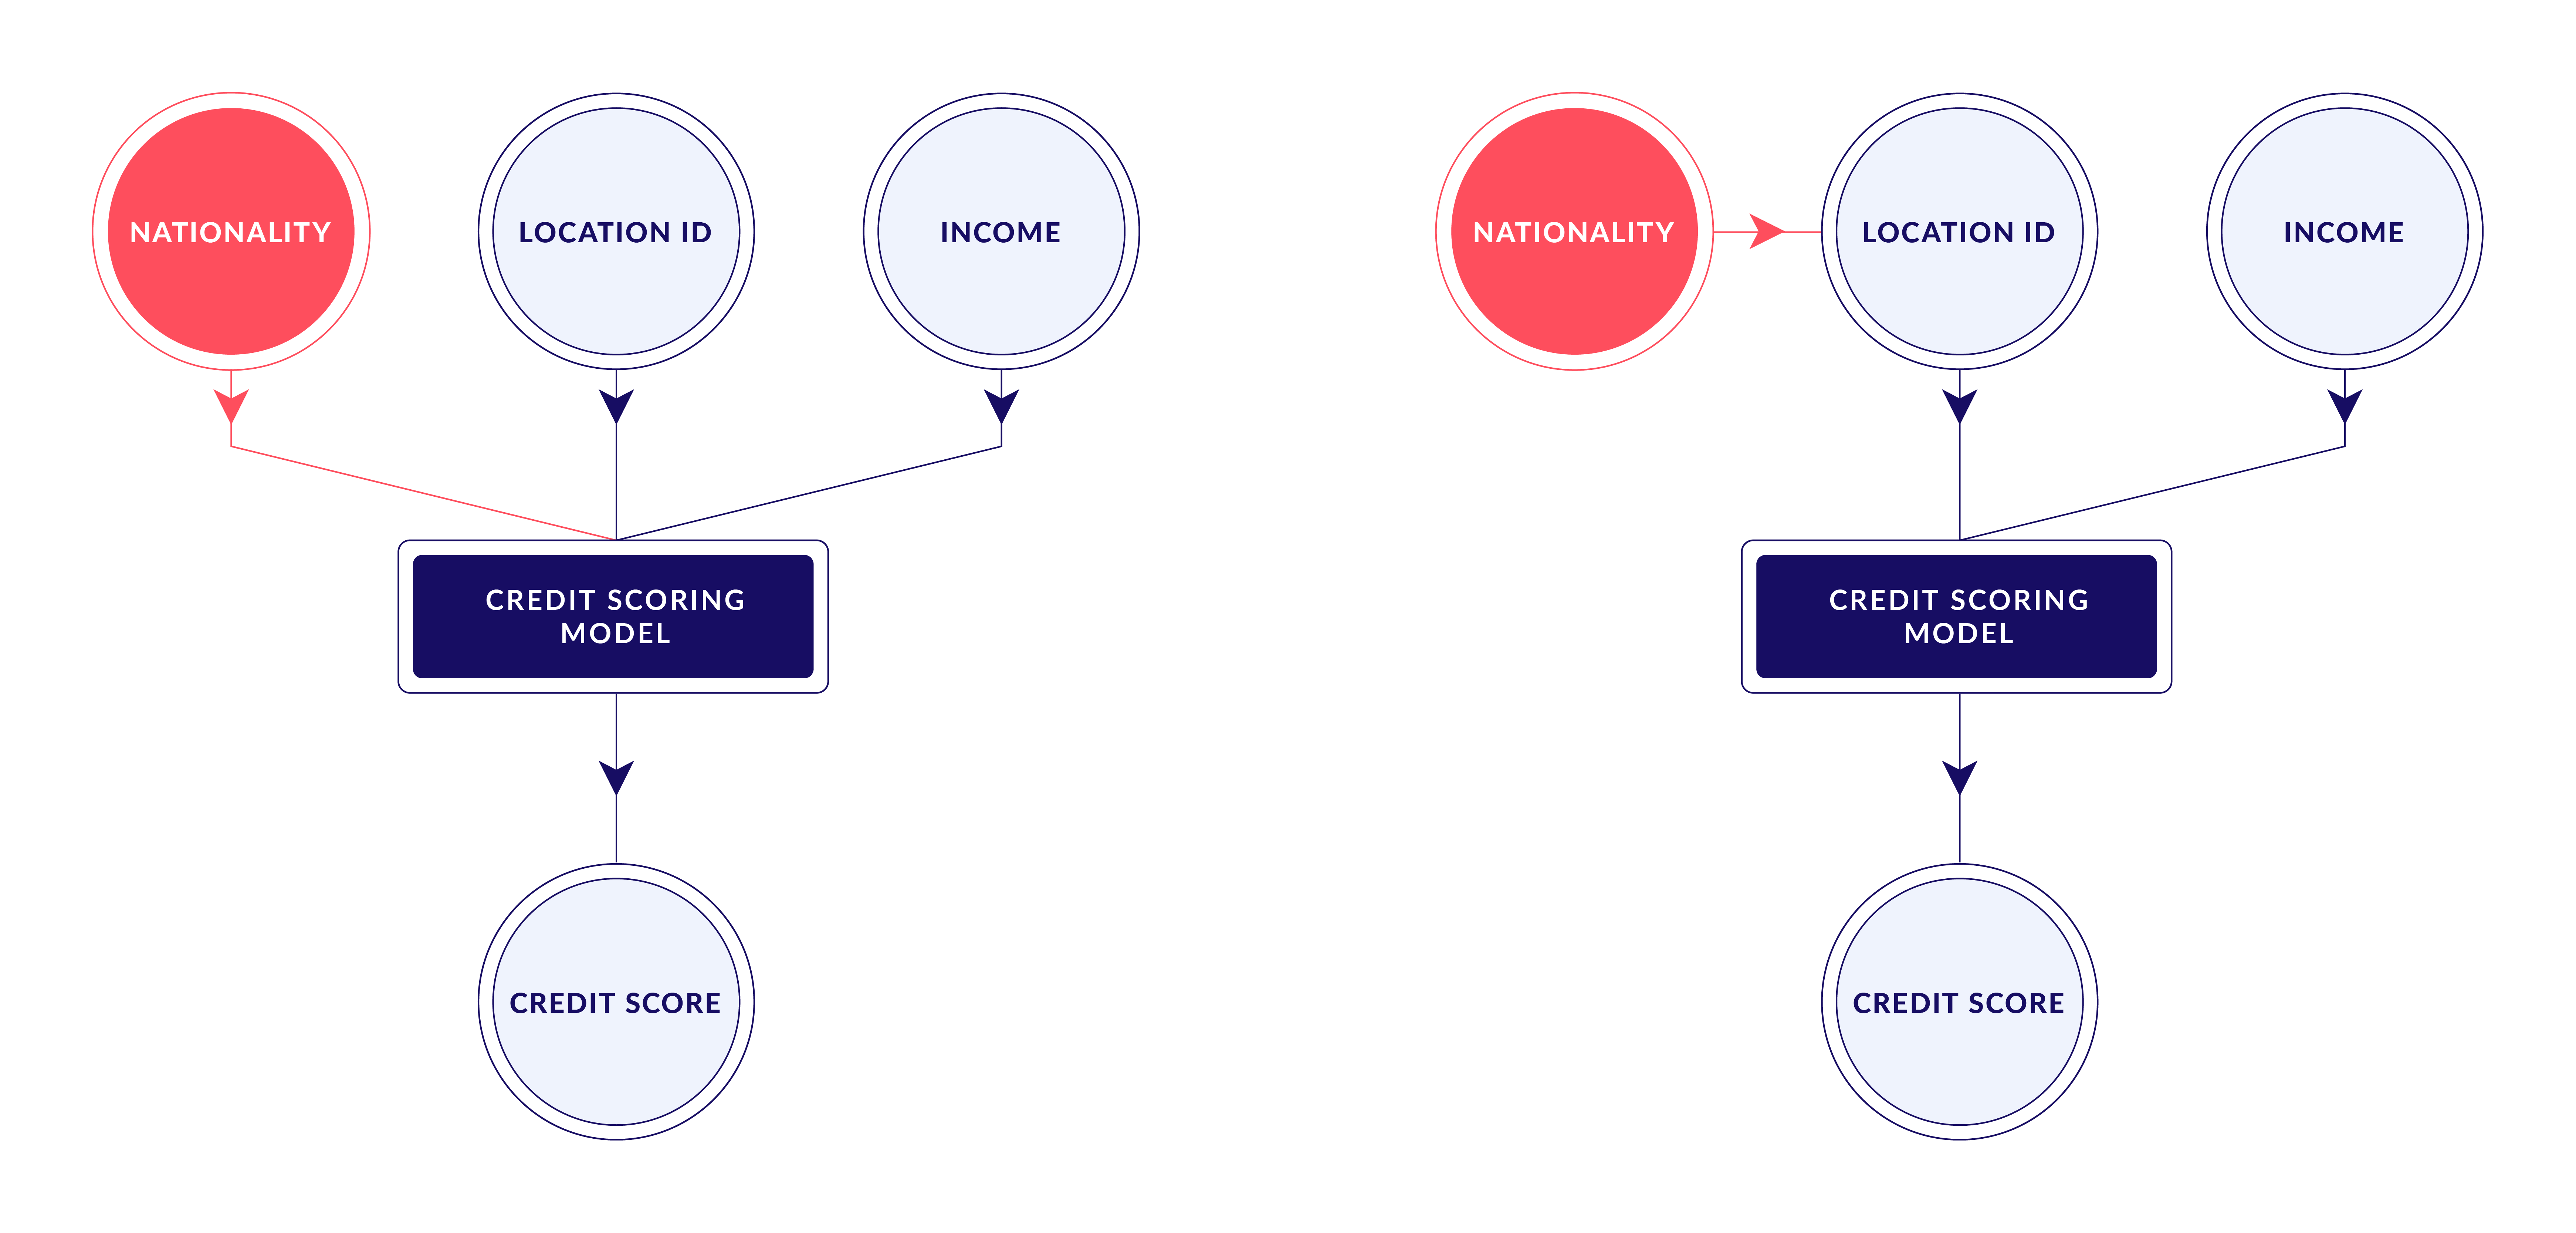
Consequently, we define a fair machine learning model as one with no direct or indirect dependency on any sensitive features.
Quantifying Bias in COMPAS
In 2016, ProPublica did an investigative analysis of a risk assessment instrument, COMPAS, used by judges and parole officers to score the likelihood of a criminal reoffending [2]. Taking one step further, we now evaluate data consisting of the COMPAS scores for approximately 20,000 individuals, each with features such as age, gender, race, number of priors, degree charge, etc.
If we visualize the decile scores assigned by COMPAS, we notice that the distributions of scores are decreasing for most ethnicities, while the scores of African-Americans are relatively uniform.


We can quantify the above bias by measuring the statistical distance between the probability distribution of the scores of African-Americans and the probability distribution of the scores in general.

For instance, for categorical variables such as decile scores, the Wasserstein metric, also known as the Earth Mover’s Distance, can be used to measure the disparity in the distribution of the decile scores.

Using this definition of bias, we can measure the disparities in decile score distributions in all sensitive subgroups to check for discrimination.


The Earth Mover’s Distance highlights probability distributions with different shapes, imposing stronger constraints on the distributions than lower-order moments such as the difference of means [3]. The observed patterns highlight notable skews in nearly all ethnicities apart from African-Americans, who account for most of the overall distribution. Interestingly, we can see large disparities in the overall distribution of decile scores in ethnicities such as Native Americans and Asians; however, these are likely a result of underestimation [4] since measurements made on small subgroups tend to be noisy.
Now that we have a rough picture of what the data looks like let’s see which patterns are captured by a logistic regressor trained on the data to predict whether or not an individual has a risk of reoffending.


Since the output probabilities are continuous, we can use the Kolmogorov-Smirnov test to quantify their distances. The Kolmogorov-Smirnov test will test the hypothesis that the sensitive sub-sample is drawn from the same distribution as the original data.


As we’d expect, the biases in the predicted probability distributions are similar to those observed in the decile scores; the model has effectively learned the distributions in the data. The smaller p-value’s above indicate that the corresponding sub-samples are not drawn from the same distribution as the entire column; for instance, the data may be skewed in either direction.
The test results can be used as a set of constraints in fair machine learning, either to indicate fairness in a pipeline or in further optimization, rebalancing. In practice, monitoring the output of a test on each group can help detect when a deployed machine learning model discriminates toward legally protected features; a statistically significant disparity in the distribution of the model’s outputs within any sensitive subgroup can indicate prejudice. On the other hand, if all output distributions are nearly identical, i.e., none of the reported distances are statistically significantly; we have effectively achieved strong demographic parity [5], which assures us with certain confidence that there is no causal relationship between the estimated variable and the sensitive features.
Final Notes
A caveat of using statistical distance metrics such as the Earth Mover’s Distance and the Kolmogorov-Smirnov distance is that they produce strong constraints for fairness which are difficult to achieve in practice. In the interest of maximizing utility in fair machine learning, it may be useful to relax the constraints imposed by the metrics, for example, by using a one-sided hypothesis test. Alternatively, filtering out skews in a certain direction may also help relax the constraints.
At Synthesized, we’re excited to work with the open-source community to build tools that empower data ethics and fair machine learning. We have recently open-sourced our python library, FairLens, which can help reproduce the above analysis. See the notebook for this article or the FairLens documentation for more details.
Follow Synthesized on X and subscribe to our blog for more news! We’d love to know about any other interesting data engineering topics you would like us to cover!
References
- Solon Barocas, Moritz Hardt, and Arvind Narayanan. Fairness and Machine Learning. 2019.
- Lauren Kirchner Jeff Larson, Surya Mattu and Julia Angwin. How we analyzed the COMPAS recidivism algorithm. 2016.
- Oneto L, Chiappa S. Fairness in machine learning. Recent Trends in Learning From Data. 2020 Apr 3:155-96.
- T. Kamishima, S. Akaho, and J. Sakuma. Fairness-aware learning through regularization approach. Data Mining Workshops (ICDMW), IEEE 11th International Conference on, pages 643–650. IEEE, 2011.
- Jiang R, Pacchiano A, Stepleton T, Jiang H, Chiappa S. Wasserstein fair classification. Uncertainty in Artificial Intelligence 2020 Aug 6 (pp. 862-872). PMLR.
FAQs
What are some limitations of the statistical distance metrics used in fair machine learning?
While effective in quantifying bias, metrics like Earth Mover's Distance and Kolmogorov-Smirnov distance impose stringent constraints that can be challenging to meet perfectly in real-world scenarios. To optimize for utility, it may be beneficial to consider relaxing these constraints, such as through one-sided hypothesis testing or filtering out skews in a specific direction.
How can the findings from fairness tests be used in practice?
Test results can guide model adjustments to ensure fairness. Monitoring output distributions for different groups helps detect discrimination in deployed models. If significant disparities exist, adjustments like rebalancing might be necessary. Conversely, nearly identical distributions indicate strong demographic parity, suggesting no causal link between the estimated variable and sensitive features, thereby affirming fair machine learning.
Can this approach be applied to other datasets besides COMPAS?
The methods discussed are adaptable to various datasets and provide a general framework for assessing fairness in discrete or continuous random variables with respect to discrete sensitive variables. By measuring statistical distances in probability distributions, this approach can be effectively applied to quantify discriminatory patterns in any dataset.
What are the implications of addressing fairness in machine learning for the future?
By actively measuring and mitigating bias in machine learning models, we contribute to a more equitable and just society. Fair machine learning ensures that algorithmic decisions are not discriminatory and do not perpetuate existing societal biases. This is crucial in high-impact areas like hiring, loan granting, insurance, and criminal justice, where fairness and unbiased decision-making are paramount.


